

Oil Demand is Outweighing Supply: Inventory Analysis
Oil Demand is Outweighing Supply: Inventory Analysis
(Important Disclaimer at the Bottom)

Oil Narrative Has Shifted With Improving Fundamentals:
As markets are captivated by the OPEC+ meetings this week and the ensuing drama, it has become timely to share some oil market analysis we have been working on at Bison. The first part is an analysis of oil inventories and the shift in oil sentiment and price as inventories have drawn down substantially. You can find this below. The next part may be shared in coming weeks. This oil market analysis is the continuation of an effort we started last year to update you on relevant market dynamics, in particular variant Bison views such as: Mid-Con and Waha gas and NGL pricing shifting to premiums, and Canada's transport situation improving. Bison's June performance update should be coming out next week, and in that we may illustrate some of the specific investment-level success these variant views have been linked to. Without further ado, Bison's inventory analysis:
Over the past year, the narrative on the oil and gas sector has shifted from nearly universally negative following the oil price crash in 2020, to more bullish by mid-year 2021. Recent forecasts from large investment banks have been increasingly bullish as well, with Goldman Sachs increasing their 3Q oil price projections to $80.00, and Bank of America stating that expectations of “strong demand recovery would outpace supply in coming months and could lead to oil prices briefly hitting $100 per barrel in 2022.”
One of the major reasons that the narrative on crude oil has become more bullish is that the latest reports on crude inventories show a rapidly tightening market, well beyond prior expectations. Oil production has risen much slower than oil demand, which has nearly returned to pre-pandemic levels, causing a major decrease in crude oil inventories in recent months. Below, we address the recent changes in the crude oil physical market and share our thoughts on the relevant implications.
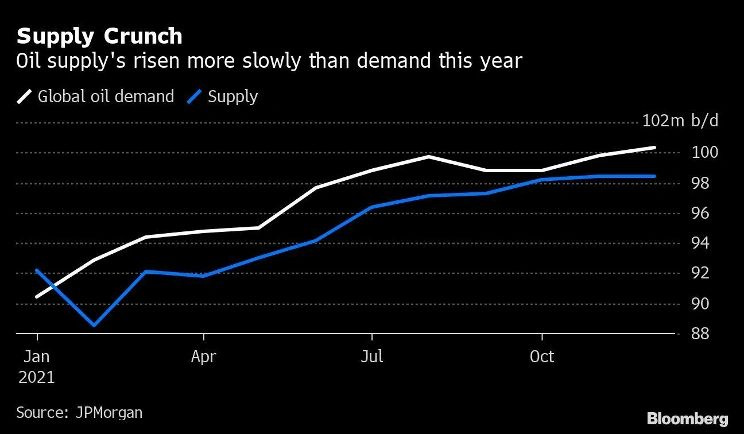
Source: JPMorgan
Current State of Inventories
Oil inventories help illustrate the supply side of crude oil fundamentals. Weekly crude oil inventory reports show current storage levels and the difference between production and consumption over a given period. Inventories increase (or build) when there is more production than consumption in the previous period, and decrease (or are drawn down) when consumption outweighs production in the previous period. When oil stockpiles are much lower than historical averages or are rapidly drawn down, we are more likely to see steep oil price increases.
U.S. crude inventory numbers are released on a weekly basis by the U.S. Energy Information Administration (EIA) and American Petroleum Institute (API), both of which have shown crude inventories falling steeply in the past 6 weeks. API reported that U.S. crude inventories fell by 8 million barrels for the week ended July 1, following a draw of 8.2 million barrels reported for the previous week. Additionally, the July 8th release of EIA’s Weekly Petroleum Report, showed a U.S. commercial crude oil inventory draw of 6.9 million barrels for the week ending July 2, compared with a 6.7 million barrel draw for the previous week. Both agencies reported drawdowns that exceeded analyst expectations of a 4-million-barrel decrease in crude oil inventories for the week.
The rate of recent inventory drawdowns has been remarkable as well. The EIA reported that over the last 4 weeks, total crude inventories (including the Strategic Petroleum Reserve) have fallen at a rate of nearly 1.2m barrels per day, or the largest 4-week stock drawn on rolling data going back almost 40 years. At 445.5 million barrels, U.S. crude oil inventories are about 7% below the five-year average for this time of year. The excess crude oil inventories, which built up in 2020 during the COVID-19 economic pause, have been depleting at an exceptional pace, signaling a tighter physical market.
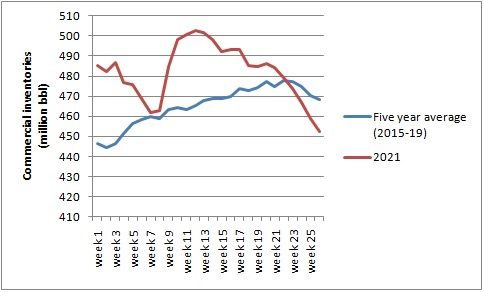
Source: EIA, July 2021
WTI Futures Curve Chart and Spot Prices
Another indication of a tight market is the steepening backwardation exhibited in the crude oil futures curve. Futures contracts illustrate what people are willing to pay today for barrels at a future date. In backwardation, spot prices hold a premium to future prices, and inventories are typically drained for immediate use. In contango, spot prices are at a discount, and it’s more economic to store barrels to sell later.
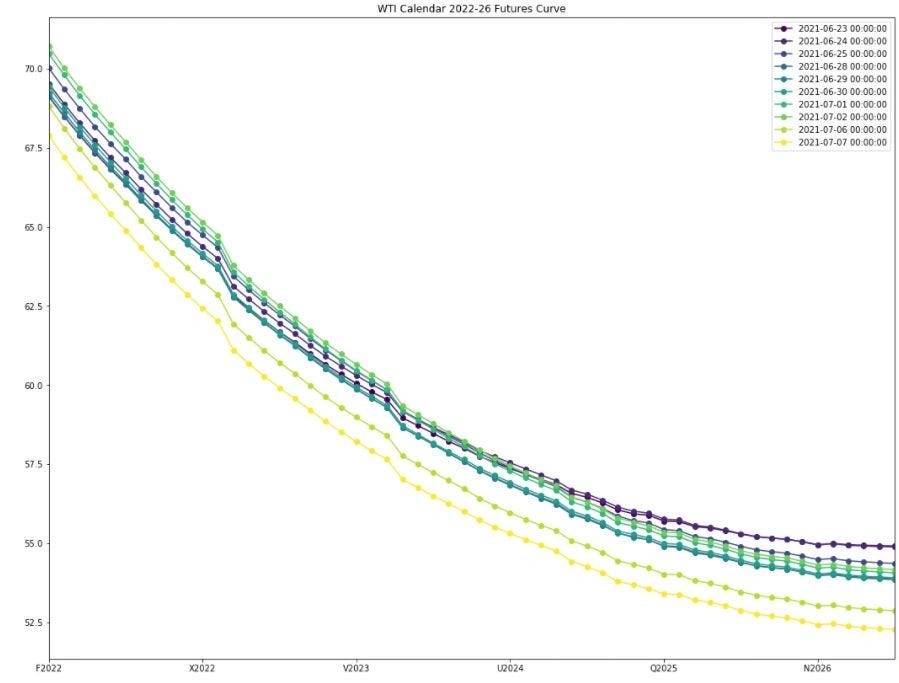
Source: Cornerstone Global Commodities
In the WTI Calendar 2022-2026 Futures Curve chart above, we can see that the forward curve is in steep backwardation and has shifted down in recent weeks (between 6/23/2021 and 7/7/2021). This tightening in the physical market, as well as recent positive sentiment, have contributed to a sustained appreciation in crude oil prices over the last few months. WTI prices have remained above the $70 mark continuously since June 10th, 2021, and above $65 since May 24th, 2021. This week, WTI briefly exceeded $75 per barrel on Tuesday July 6th, 2021, touching highs not seen since November 2014, before pulling back to $72 on Thursday July 8th.
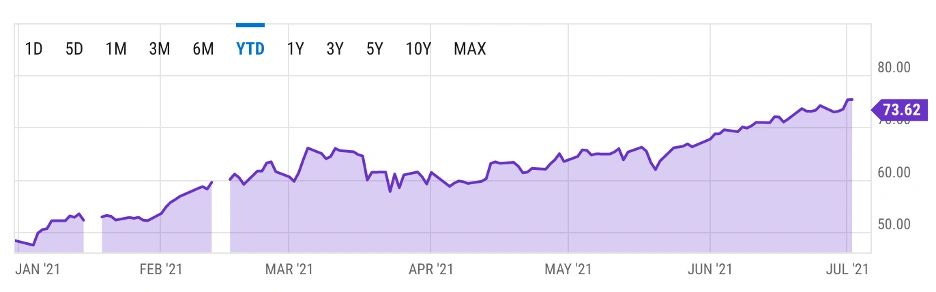
WTI Crude Oil Spot Price Chart (7/8/2021), Source: Ycharts.com
Conclusion and Thoughts
The data around crude oil inventories tells us two things: current demand outweighs new supply, and crude oil inventories are falling fast. With oil prices increasing materially in response, the current major risk to sustained oil prices is that OPEC and U.S. shale producers could flood the market with new production from their spare production capacity. Historical evidence suggests that an oil price in the $65-75 range would incentivize producers to bring additional barrels online, however, today’s oil and gas landscape is different than that of the past.
It’s true that many recent potential oil price rallies have been thwarted by the “drill baby, drill” mentality of U.S. shale producers, but so far in 2021, we have seen North American publicly traded E&P companies exhibit far more capital discipline. This is likely a response to shareholder concerns after years of capital destruction, and we will see how much longer North American E&Ps can remain composed in this high-priced environment. Additionally, there may be more difficulty ramping up production materially for both OPEC and Non-OPEC producers next year.
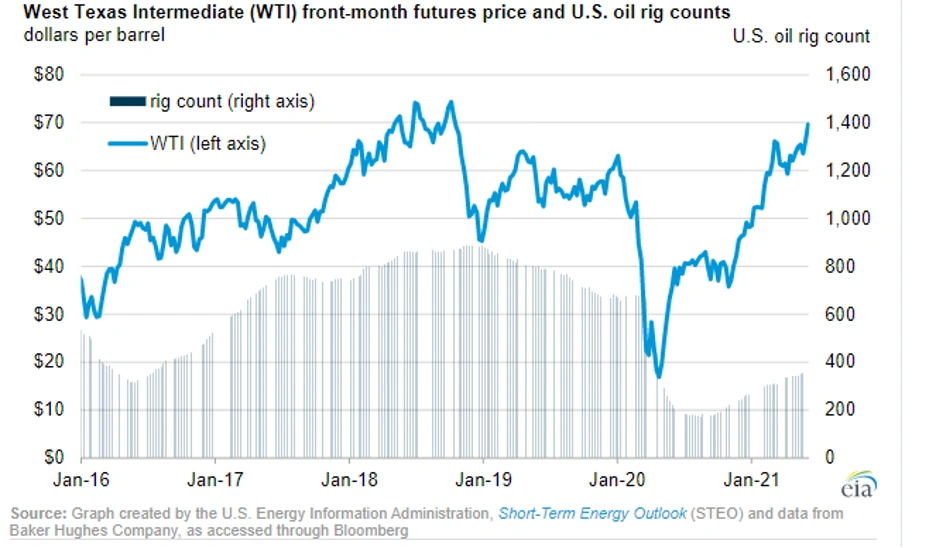
Sources: EIA, Baker Hughes
“But OPEC+…?”
Capital starvation in the oil and gas sector since the 2014 downturn has resulted in a lack of investment in oil production and infrastructure over the last decade, substantially decreasing likely global reserves and production capacity. Also, OPEC+ spare capacity could be less than advertised, and may not be enough to satiate increasing demand.
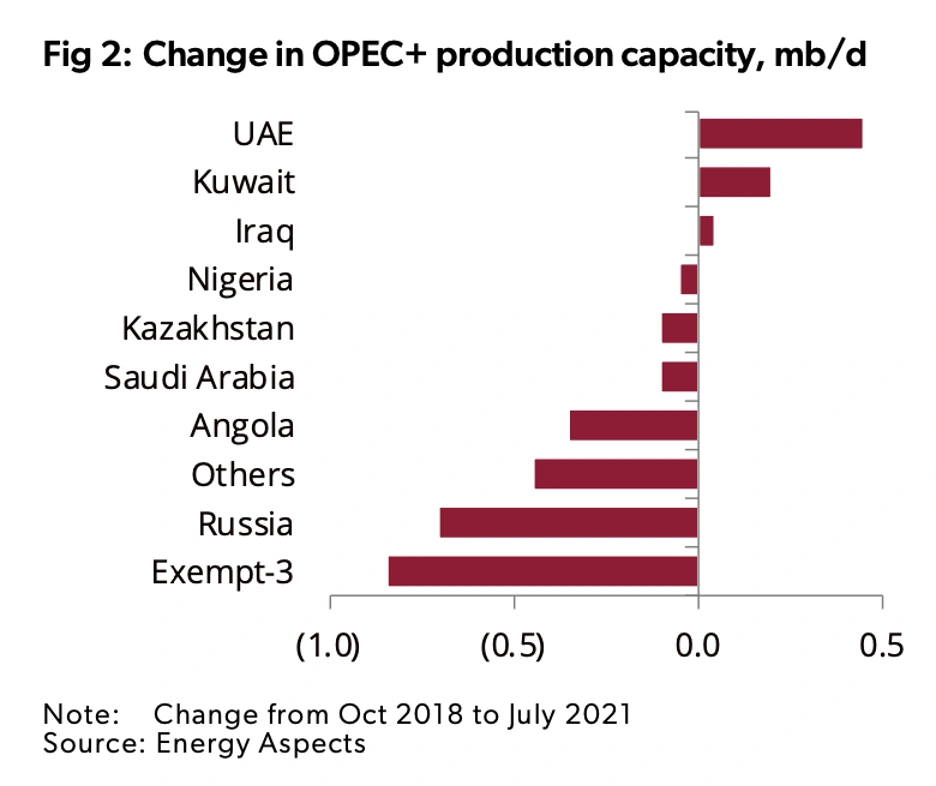
Bison may expand on this OPEC+ capacity variance in further analysis on global spare capacity.
The end result of this inventory analysis: a convergence of factors have left the market tighter and more susceptible to rapid price increases than in prior years.
Important Disclaimer: Opinions expressed herein by the author are not an investment recommendation and are not meant to be relied upon in investment decisions. The author is not acting in an investment adviser capacity. This is not an investment research report. The author's opinions expressed herein address only select aspects of potential investment in securities of the companies mentioned and cannot be a substitute for comprehensive investment analysis. Any analysis presented herein is illustrative in nature, limited in scope, based on an incomplete set of information, and has limitations to its accuracy. The author recommends that potential and existing investors conduct thorough investment research of their own, including detailed review of the companies' SEC and CSA filings, and consult a qualified investment adviser. The information upon which this material is based was obtained from sources believed to be reliable, but has not been independently verified. Therefore, the author cannot guarantee its accuracy. Any opinions or estimates constitute the author's best judgment as of the date of publication and are subject to change without notice. The author and funds the author advises may buy or sell shares without any further notice.